Microsoft Excel 2016 Level 4.2: Analyzing Data by Using PivotTables

- Product ID
- sonie16pt_vod
- Training Time ?
- 29 to 37 minutes
- Language(s)
- English
- Video Format
- High Definition
- Required Plugins
- None
- Number of Lessons
- 5
- Quiz Questions
- 8
- Closed Captioning
- Question Feedback
- Wrong Answer Remediation
- Lesson Bookmarking
- Downloadable Resources

This course takes a deeper look at how to analyze data by using PivotTables in Excel 2016. When you create a PivotTable, Excel automatically totals the data by either summarizing or counting the items. If you are looking for more than a simple sum or count, or want to total only certain data in your PivotTable, you can customize how your data is presented and calculated using the value field settings. Another option would be to create a custom calculated field in your PivotTable. This course demonstrates several ways to analyze your data with PivotTables.
You must be able to organize your data so it is easy to understand and interpret. For example, you may want to show the best results at the top of a list. You can also filter the data found in a PivotTable or change the format of the PivotTable itself to ensure you have provided enough functionality without cluttering the overall experience. This course shows you how to accomplish these tasks.
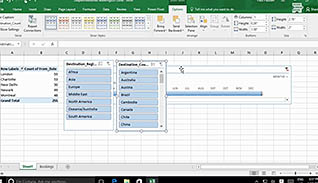
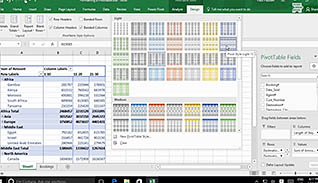
A PivotTable is a powerful feature in Excel. It allows you to extract specific pieces of information from a larger set of data; in short, it allows you to focus on what you determine to be the important parts of that data. Utilize the information presented here and understand how to better sort, analyze, and present your data through PivotTables.
![]() This course is in the Video On Demand format, to read about Video On Demand features click here.
This course is in the Video On Demand format, to read about Video On Demand features click here.

- Full-screen video presentation
- Print certificate and wallet card
- You have 30 days to complete the course
Excel 2016 users
- Summarize PivotTable Data
- Organize PivotTable Data
- Filter PivotTable Data
- Format A PivotTable
- Refresh And Change PivotTable Data
-
Summarize PivotTable data.
- Recall where a calculated field would appear with regards to a PivotTable.
- Identify how to reset a PivotTable summary of a cell.
-
Organize PivotTable data.
- Select options for grouping data in PivotTables.
- Identify available features to help organize data in PivotTables.
-
Filter PivotTable data.
- Recall which features will enable you to filter your data.
-
Format a PivotTable.
- Select available options in the Layout command group.
-
Refresh and change PivotTable data.
- Identify a shortcut for updating a PivotTable if source data changes.
- Recall where you can view the information about the file you are connected to.
© Mastery Technologies, Inc.
