Microsoft Excel 2016 Level 2.4: Visualizing Data with Charts

- Product ID
- sonie16vd_vod
- Training Time ?
- 23 to 32 minutes
- Language(s)
- English
- Video Format
- High Definition
- Required Plugins
- None
- Number of Lessons
- 6
- Quiz Questions
- 9
- Closed Captioning
- Question Feedback
- Wrong Answer Remediation
- Lesson Bookmarking
- Downloadable Resources

This training course helps new and experienced Excel users create attractive charts, enabling people to visualize the data contained in an Excel spreadsheet. The course provides step-by-step instructions for creating charts based on data sets.
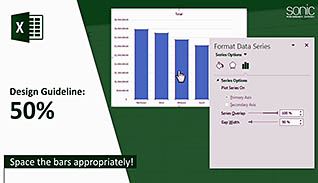
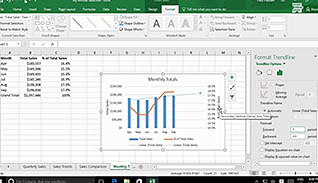
The trainer shows which chart type to use to display certain types of data. Viewers also learn how to modify and format charts to maximize readability using the “live preview” feature in the chart toolbox. The utility of applying chart styles for quick and easy formatting is detailed. Using the chart elements and chart styles buttons is demonstrated. Viewers also learn how to create a dual-axis chart with trend lines. Finally, the video training explains the use of chart templates, as well as how to create and use a chart template as a tremendous time-saving tool.
Excel 2016 has simplified creating charts and this video shows viewers how to use the program’s tools to create a visually appealing display, making data more meaningful and attractive.
![]() This course is in the Video On Demand format, to read about Video On Demand features click here.
This course is in the Video On Demand format, to read about Video On Demand features click here.
- Full-screen video presentation
- Print certificate and wallet card
- You have 30 days to complete the course
New and experienced Excel users
- Create Charts
- Modify and Format Charts
- Use Advanced Chart Features
- Create a Dual-Axis Chart
- Create a Chart Template
- Visualizing Data with Charts - Best Practices
-
Create charts.
- Identify several ways of creating charts.
-
Modify and format charts.
- Recognize how to improve readability of a chart.
- Distinguish between modifying a chart and formatting a chart.
- Identify which buttons will appear when clicking inside a chart.
-
Create a dual-axis chart.
- Describe how to create a dual-axis chart.
- Recall how dual-axis charts can be used.
-
Create a chart template.
- Recall how to create a chart template.
- Identify where to find a chart template.
© Mastery Technologies, Inc.
