Microsoft Excel 2016 Level 4.3: Working with PivotCharts

- Product ID
- sonie16wp_vod
- Training Time ?
- 14 to 18 minutes
- Language(s)
- English
- Video Format
- High Definition
- Required Plugins
- None
- Number of Lessons
- 3
- Quiz Questions
- 4
- Closed Captioning
- Question Feedback
- Wrong Answer Remediation
- Lesson Bookmarking
- Downloadable Resources
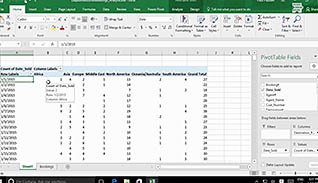
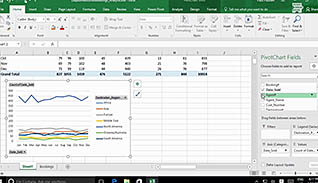
PivotTables enable you to present business intelligence information quickly and easily, and PivotCharts help you take your data one step further. By presenting data graphically through PivotCharts, viewers can tell at a glance what your data signifies. Use this course to learn how to create PivotCharts, manipulate their data, and format them.
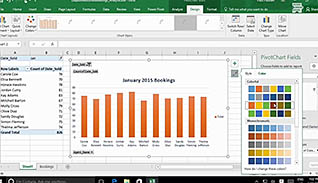
This course starts by demonstrating how easy it is to create a PivotChart. Once you create your PivotChart, you may want to manipulate the data within. This could include narrowing the focus of the chart, for example. Like the PivotTable, you can do so using the Task Pane. Once you are satisfied with how your data is displayed, you may wish to further format your PivotChart by including a title or other additional elements, or even by changing the style of your PivotChart.
PivotCharts allow you to seamlessly take sorted and analyzed information and display it in an easy-to-understand way. This allows you to present and showcase your information much more effectively. Utilize the information presented in this training video and learn how to employ another incredibly useful component of Excel: the PivotChart.
![]() This course is in the Video On Demand format, to read about Video On Demand features click here.
This course is in the Video On Demand format, to read about Video On Demand features click here.

- Full-screen video presentation
- Print certificate and wallet card
- You have 30 days to complete the course
Excel 2016 users
- Create a PivotChart
- Manipulate PivotChart Data
- Format a PivotChart
-
Create a PivotChart.
- Identify what are linked to PivotCharts.
- Recall options available when creating PivotCharts.
-
Manipulate PivotChart data.
- Recall how data that you want to see in your PivotChart is indicated in a slicer.
-
Format a PivotChart.
- Identify features found in the Add Chart Element button.
© Mastery Technologies, Inc.
